- Topic
39k Popularity
23k Popularity
49k Popularity
17k Popularity
46k Popularity
19k Popularity
7k Popularity
4k Popularity
96k Popularity
29k Popularity
- Pin
- 🎊 ETH Deposit & Trading Carnival Kicks Off!
Join the Trading Volume & Net Deposit Leaderboards to win from a 20 ETH prize pool
🚀 Climb the ranks and claim your ETH reward: https://www.gate.com/campaigns/site/200
💥 Tiered Prize Pool – Higher total volume unlocks bigger rewards
Learn more: https://www.gate.com/announcements/article/46166
- 📢 ETH Heading for $4800? Have Your Say! Show Off on Gate Square & Win 0.1 ETH!
The next bull market prophet could be you! Want your insights to hit the Square trending list and earn ETH rewards? Now’s your chance!
💰 0.1 ETH to be shared between 5 top Square posts + 5 top X (Twitter) posts by views!
🎮 How to Join – Zero Barriers, ETH Up for Grabs!
1.Join the Hot Topic Debate!
Post in Gate Square or under ETH chart with #ETH Hits 4800# and #ETH# . Share your thoughts on:
Can ETH break $4800?
Why are you bullish on ETH?
What's your ETH holding strategy?
Will ETH lead the next bull run?
Or any o
- 🧠 #GateGiveaway# - Crypto Math Challenge!
💰 $10 Futures Voucher * 4 winners
To join:
1️⃣ Follow Gate_Square
2️⃣ Like this post
3️⃣ Drop your answer in the comments
📅 Ends at 4:00 AM July 22 (UTC)
- 🎉 #Gate Alpha 3rd Points Carnival & ES Launchpool# Joint Promotion Task is Now Live!
Total Prize Pool: 1,250 $ES
This campaign aims to promote the Eclipse ($ES) Launchpool and Alpha Phase 11: $ES Special Event.
📄 For details, please refer to:
Launchpool Announcement: https://www.gate.com/zh/announcements/article/46134
Alpha Phase 11 Announcement: https://www.gate.com/zh/announcements/article/46137
🧩 [Task Details]
Create content around the Launchpool and Alpha Phase 11 campaign and include a screenshot of your participation.
📸 [How to Participate]
1️⃣ Post with the hashtag #Gate Alpha 3rd - 🚨 Gate Alpha Ambassador Recruitment is Now Open!
📣 We’re looking for passionate Web3 creators and community promoters
🚀 Join us as a Gate Alpha Ambassador to help build our brand and promote high-potential early-stage on-chain assets
🎁 Earn up to 100U per task
💰 Top contributors can earn up to 1000U per month
🛠 Flexible collaboration with full support
Apply now 👉 https://www.gate.com/questionnaire/6888
[Japanese Stocks] Approaches to Finding Promising Stocks: Revisiting Market Themes. Analysts Decipher the Essence of the Themes | Manekuri Monex Securities' Investment Information and Media Useful for Money
The Nikkei average has been moving in a see-saw manner at high levels. Although the tax rate initially proposed by the United States in the tariff negotiations was severe, it seems that the absence of negative surprises has led to a solid development.
However, the impression that the Japanese economy's business sentiment is showing signs of decline cannot be dispelled. The recently announced real wages have decreased by as much as 2.9% (which is a significantly large figure), and although there was a temporary shift to positive during the bonus month, the situation has generally remained negative otherwise. It is hard not to see the consumer sector's driving force for the economy as rather weak. As for corporate performance in the first quarter, based on what I have seen and heard about the current situation, there don't seem to be many examples of unexpectedly strong results.
Furthermore, depending on the results of the upcoming House of Councillors election, which is expected to be competitive, there are concerns that the flexibility of policy management may decline, potentially dampening economic sentiment. Last time, I pointed out that "while the music is playing, we should enjoy the dance, but the end of the party means that clean-up awaits." I would like to believe that the music is still playing, but perhaps it is also time to start preparing for the clean-up.
Second-hand Goods Distribution Shop = "Reuse Shop"
Now, let's focus on the theme of "reuse shops." Strictly speaking, it should be called "reuse shops." In Japan, the term recycling is used quite broadly, but essentially it means "resource recovery," which is a different concept from reuse, where second-hand goods are reused as they are. I would like to clearly define that the second-hand goods distribution shops we often see in our neighborhoods are strictly reuse shops.
The theme of this reuse shop gained attention around 2021-2022. At that time, with the lingering effects of the pandemic, the needs for disposing of unused household items and easily procuring affordable household goods due to the spread of stay-at-home orders and remote work matched well with reuse shops, leading to a rise in their valuation in the stock market. It is a regret that this was not covered in the column at that time, but considering that the reuse market has become firmly established in our lives since then, it can certainly be said that it was a theme with significant impact.
This is not a revenge for the last time, but considering the possibility that the demand for more efficient shopping with second-hand goods may rise again due to the continued decline in real wages caused by rising prices, I decided to take up this theme early (reflecting on missing the opportunity last time). I can only hope that this decision will work out well (laughs).
The size of the reuse market has roughly doubled over the past 10 years.
Let's briefly review the trends in the reuse market. According to a survey by the Ministry of the Environment, the scale of the reuse market in 2021 was 675 billion yen, of which the retail of second-hand goods accounted for about 451 billion yen, retail of used books was 116 billion yen, retail of electrical products was 70 billion yen, and retail of antiques was 38 billion yen. In addition, the used car sales market is estimated to be approximately 3.4 trillion yen (2016).
Additionally, there are private surveys that estimate the reuse market in 2020 to be 2.4 trillion yen. While this survey does not include used cars, it does include used motorcycles and scooters, and it also encompasses CtoC transactions utilizing online platforms and non-store BtoC transactions, which distinguishes it from the Ministry of the Environment's survey. However, when excluding the impacts of CtoC/BtoC online transactions and used motorcycles/scooters from this private survey, the figures are quite similar to those of the Ministry of the Environment's survey.
According to this private survey, the size of the reuse market has approximately doubled over the ten years since 2010, with more than 60% of the market being conducted through online transactions as of 2020. By product category, clothing and groceries account for about 17%, while branded goods, furniture, and home appliances each account for 10%. Toys and models, games and media, and sports and leisure goods follow, with these six product categories reportedly making up over half of the entire market. This statistic may be closer to our image of the "reuse shop" industry.
Considering PER and Cash Conversion Cycle (CCC)
So, what kind of brands can we pay attention to in the reuse market? Generally speaking, it is customary to select brands based on specific product areas in which one excels, such as related to this field or brand-related, etc. However, here I would like to propose an approach that takes a slightly different perspective.
The following figure is a scatter plot with the PER of major reuse companies on the vertical axis and the cash conversion cycle (CCC) of each company on the horizontal axis.
[Chart] PER and Cash Conversion Cycle (CCC) of Reuse Companies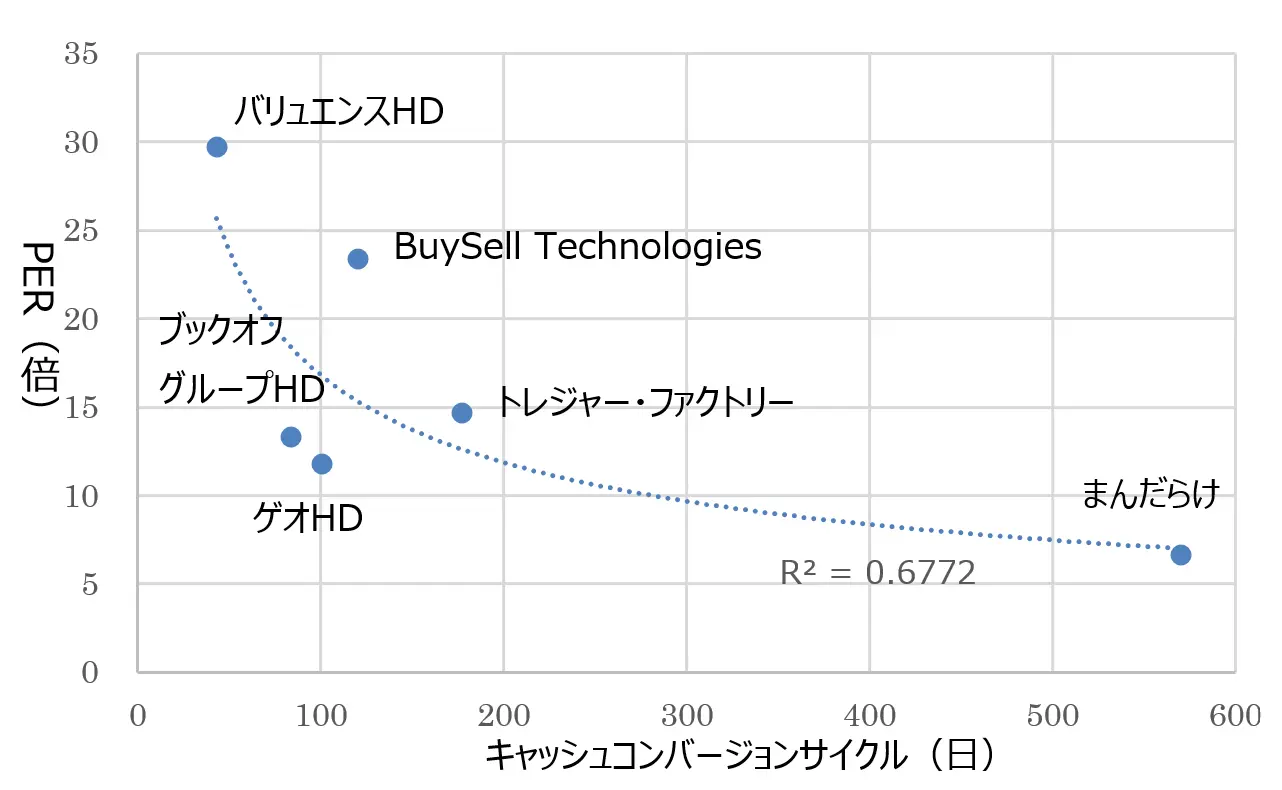 Source: Created by the author
*CCC is calculated based on the results from the most recent fiscal period.
Recycling companies often purchase products from the market with cash and sell them, so the CCC, which indicates how quickly they can convert purchased products into cash, is a very important metric. Quick cash conversion of purchased products directly relates to purchasing power and, ultimately, the expansion of business scale. It is clear that if you do not purchase enough, regardless of how many stores you have, there will not be enough products to sell. The PER indicates how much growth potential is being factored into the stock price as an expected value. The view is that, in principle, shortening the CCC should lead to an expansion of the PER.
Source: Created by the author
*CCC is calculated based on the results from the most recent fiscal period.
Recycling companies often purchase products from the market with cash and sell them, so the CCC, which indicates how quickly they can convert purchased products into cash, is a very important metric. Quick cash conversion of purchased products directly relates to purchasing power and, ultimately, the expansion of business scale. It is clear that if you do not purchase enough, regardless of how many stores you have, there will not be enough products to sell. The PER indicates how much growth potential is being factored into the stock price as an expected value. The view is that, in principle, shortening the CCC should lead to an expansion of the PER.
Create a scatter plot from public information as material for stock research
In this context, taking into account the liquidity of stock prices and the validity of valuations, we focused on companies with a market capitalization of over 10 billion yen and a dividend yield of less than 4%. As shown in the figure, the actual plots of each company align with an approximate curve that corresponds to this perspective. The coefficient of determination of this approximate curve (power approximation) is 0.62, indicating that it is statistically significant. Therefore, it is possible to consider that stocks deviating from this approximate curve are "tendentially" undervalued or overvalued.
CCC can be easily calculated from the figures disclosed on the internet, and the latest PER values are now readily available. By updating this scatter plot with each financial report, you should be able to determine whether the undervaluation/overvaluation is increasing or decreasing relative to the approximation phase. However, please do not forget that these are merely relative judgments. I have previously introduced a similar approach with ramen-related stocks in the fall of 2024, and I hope you can enjoy the essence of stock research through such approaches.